
Latest grounded valuation data insights from the US
October 28, 2025

As every BVR data from the US shows the whole rather than the noisiest picture
So much of the UK news around private companies (and therefore their valuations) is focused on hyper exciting topics such as AI, that it can be hard to understand that there is a grounded world of other companies being bought and sold all the time.
Many of you will be familiar with the idea of a buyer needing payback on the money it invests in buying another company, and most of you will understand that buying companies do not want to wait for years to get a return on their investment. When creating open market valuations this is an issue not to be ignored as it typically puts a cap on the price someone is willing to pay.
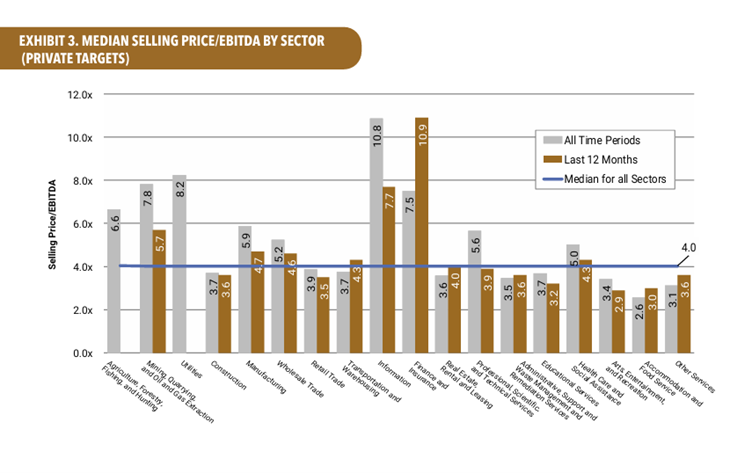
The monthly BVR statistics usually tell a similar story when they are published. Namely, that companies being sold in most sectors achieve relatively low multiples of EBITDA. This is with the exception of financial services and information technology, both of which are replete with businesses that have highly scalable (because IT driven) and high margin businesses. Such businesses mean that even if high multiples are paid on acquisition, shortly thereafter the acquiror can scale them up and still get that magical payback the board will be demanding.
Do take a look at the Q3 2025 digest from BVR which can be found HERE.
And for those of you who are too busy here are a few graphics which tell the story you need to know.
Firstly the all-industry stats.
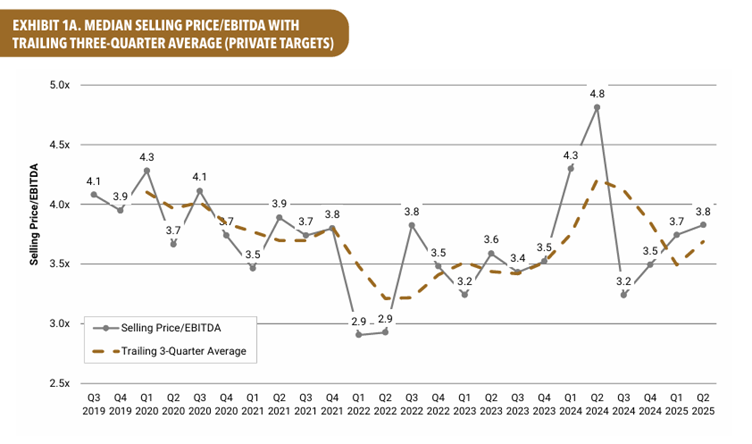
There’s no sign of the sorts of multiples being achieved by the Magnificent Seven!
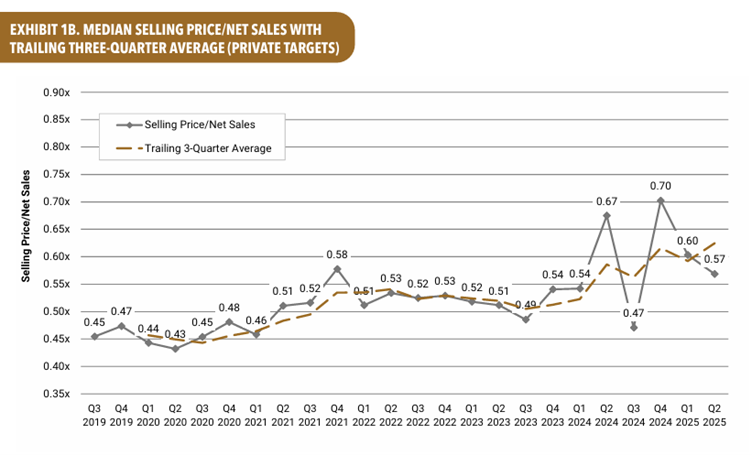
Nor is there a sign that on average companies even reach 1x sales. 0.5x isn’t a bad place to start if a “normal” company asks you what they might be worth. Although, it would be naïve not to note that the multiple has been trending up since 2019 with 20%+ appreciation in the multiple over this period. The volatility in 2024 may have started to stabilise again. Time will tell.
This is perhaps my favourite go to graphic from this particular source of statistics. It is based on US data, of course. For quoted US comparables we usually apply a discount when using them to value a UK company because of the US premium. There’s a case for applying the same approach using this data perhaps?
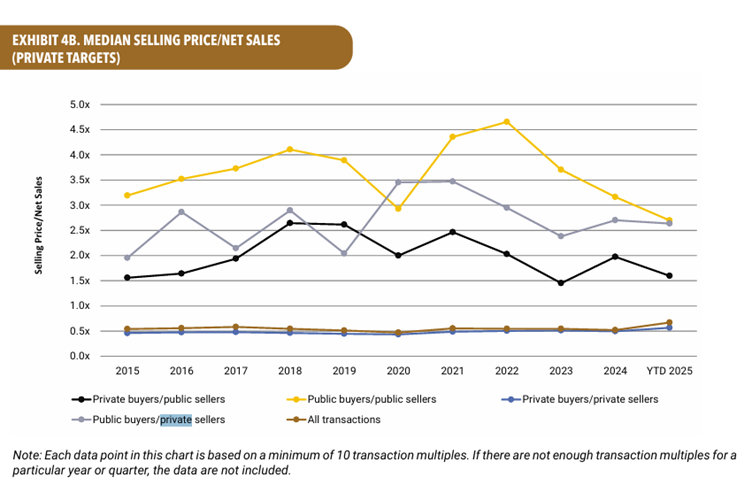
And finally, what this graph tells you is that the public markets have historically valued public businesses more highly than private ones (although not that highly based on fundamentals). And public buyers who can presumably issue paper as well as paying cash for a business, are also willing to place a premium on their private company targets. However there are signs that there is a convergence between private and public transactions which might be a theme worth monitoring.
We undertake valuations of all types including ones of assets based overseas. If you have a valuation – however easy or complicated, why not ask us to be one of the three valuers you ask to quote. You might be pleasantly surprised by our approach, our speed and our prices.